

AgInsights Model Cards
Model Card: Productivity Zones Model
What it is
Overview
Addressing field heterogeneity is a major opportunity for yield and productivity optimization by enabling growers to adapt resource utilization at a sub-field level so as to increase the profitability of any farm inputs.
The productivity zones model aims at delineating, within one field, contrasting zones in terms of crop productivity. It is trained to do so with as little user inputs as possible, but still enabling the possibility for adjustments if needed.
The model algorithm combines multi-season remote sensing data to categorize field zones into different productivity levels. These zones can then support variable seeds, fertilizer or product rate application. By applying variable rate, growers will optimize the use of resources in every area of the field.
Inputs and Outputs
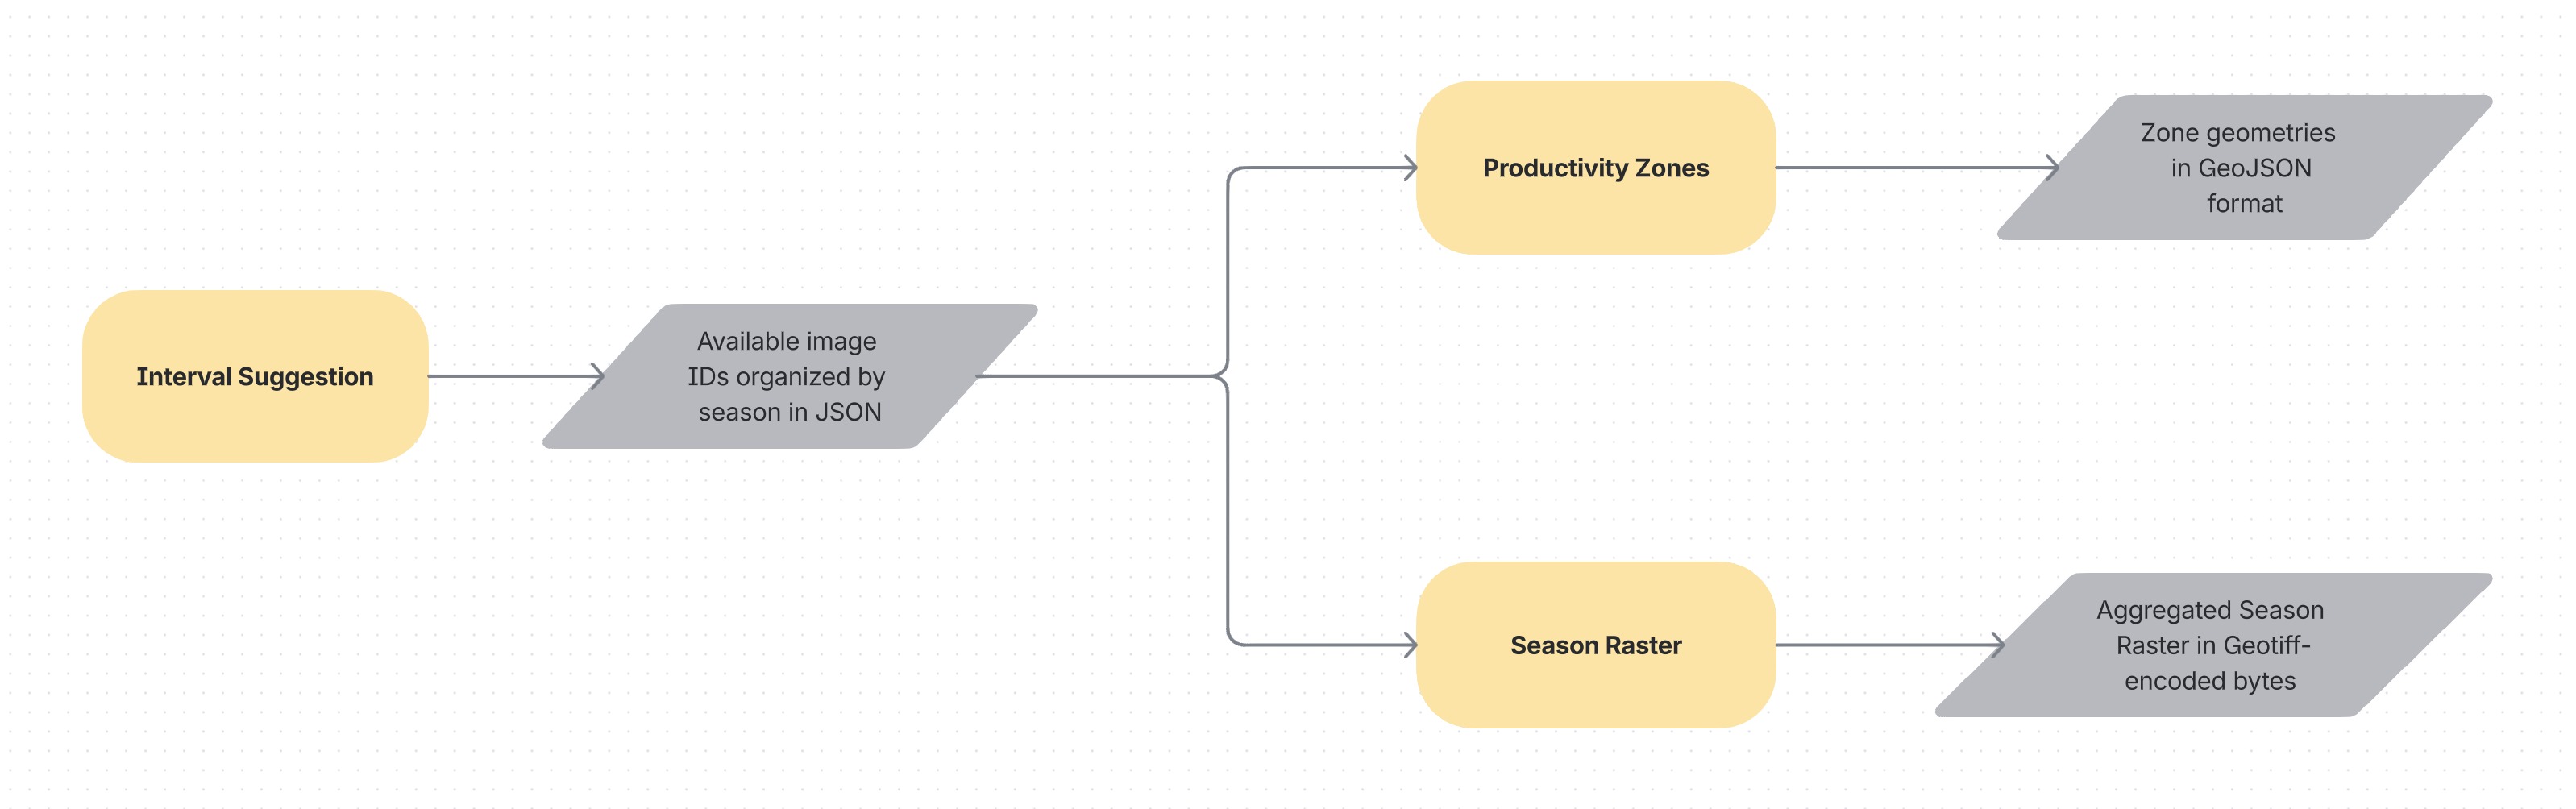
The main function of the model is to return the productivity zones field maps. It requires a multi-step approach with execution of multiple sub-models:
- Interval Suggestion
Identifies past crop seasons within a selected historical period. - Season Raster (optional)
Generates an aggregated NDVI raster for a selected season. - Productivity Zones
Produces the final productivity zones map.
1. Interval Suggestion
Required Inputs:
- Cropwise
field_id - Start date
- End date
Optional Inputs:
- Maximum cloud coverage (%)
- Exclude seasons
Output:
A JSON object listing crop seasons, associated satellite images, acquisition dates, and mean NDVI values.
2. Season Raster
Required Inputs:
- Season interval (from Interval Suggestion output)
Output:
A GeoTIFF raster showing aggregated NDVI for the selected season.
3. Productivity Zones
Required Inputs:
- Cropwise
field_id - Interval Suggestions (complete or edited)
Optional Inputs:
- Number of zones (default: automatically determined)
- Minimum polygon area threshold
- Output format (GeoJSON default; Shapefile or GeoTIFF available)
Output:
A spatial dataset (GeoJSON/Shapefile/GeoTIFF) with:
- Zone boundaries
- NDVI percentiles (p10, p25, p50, p75, p90)
- Productivity adjustment factors
- Ignored seasons (with reasons)
How it works
| interval_suggestion | season_raster | productivity_zones | |
|---|---|---|---|
| Sub-models | interval_suggestion | season_raster | productivity_zones |
| Description | This endpoint is responsible for listing all available images between an interval of dates, organize this list in intervals that contain only one season and filter out images with high cloud percentage.<br><br>After removing the clouded images the model also removes images that do not aggregate information in the series. Here, an unnecessary image is defined as an image that is similar, for both NDVI value and date, to another image. | This endpoint provides a visual representation (i.e. Seasonal Raster) for a single season interval within the list provided by the endpoint interval_suggestion.<br><br>This endpoint creates the visualization of each seasonal rasters listed and enable the users to eventually select and remove any seasonal rasters that they want to exclude from the Productivity zone computation. | This endpoint generates the main feature of this model, it is responsible for retrieving all data selected and compute the productivity zones with the desired restrains.<br><br>The output can be obtained on 3 different formats, GeoJSON, a zip file containing all necessary shapefiles or a single Geotiff where each pixel stores the number of its group. On shapefile and Geojson format together with the "group" property it also has a property called "percentiles" which stores key percentiles for recreating boxplots, and productivity_adjustment_factor. |
| Inputs | - Cropwise field ID<br>- Start date for interval of interest<br>- End date for interval of interest, if not provided it defaults to the current date<br>- Maximum cloud coverage. If not provided, defaults value is 0%, meaning only 100% cloud free images are retained. | One interval from the list returned from interval_suggestion. | - Cropwise Field ID<br>- History with intervals of interest provided by the interval_suggestion endpoint<br>- Number of zones, defaults to automatic recommendation<br>- Minimum area for keeping small regions. This value defines the minimum area of any polygon.<br>- Required output format: geojson, shapefile or geotiff. Default: geojson. |
| Outputs | A list of season intervals described by start, end and peak dates and containing the images available in those intervals. | A geotiff that provides an aggregated visual representation of the NDVI behavior during a season interval (i.e. Season Raster). | - A map containing Productivity zones in the desired output format.<br> - The percentile values (p10, p25, p50, p75, and p90) to create boxplots of NDVI values across zones.<br> - Productivity adjustment factor<br> - Ignored seasons due to possible split field |
Illustrated examples
Season intervals: Plot of the mean ndvi values from the selected images 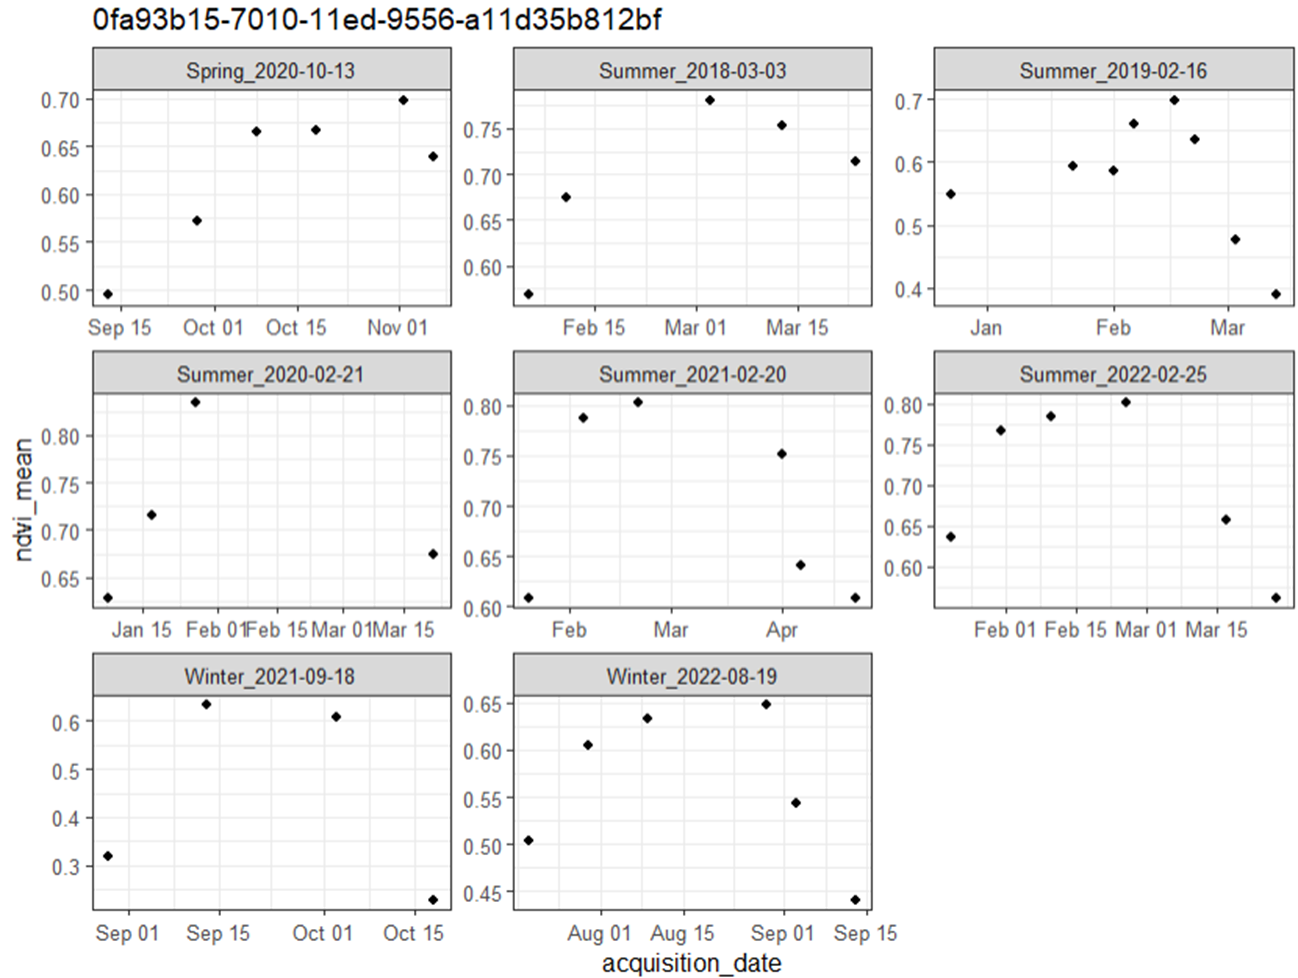
Season raster: Geotiff that provides an aggregated visual representation of the NDVI behavior during a season interval 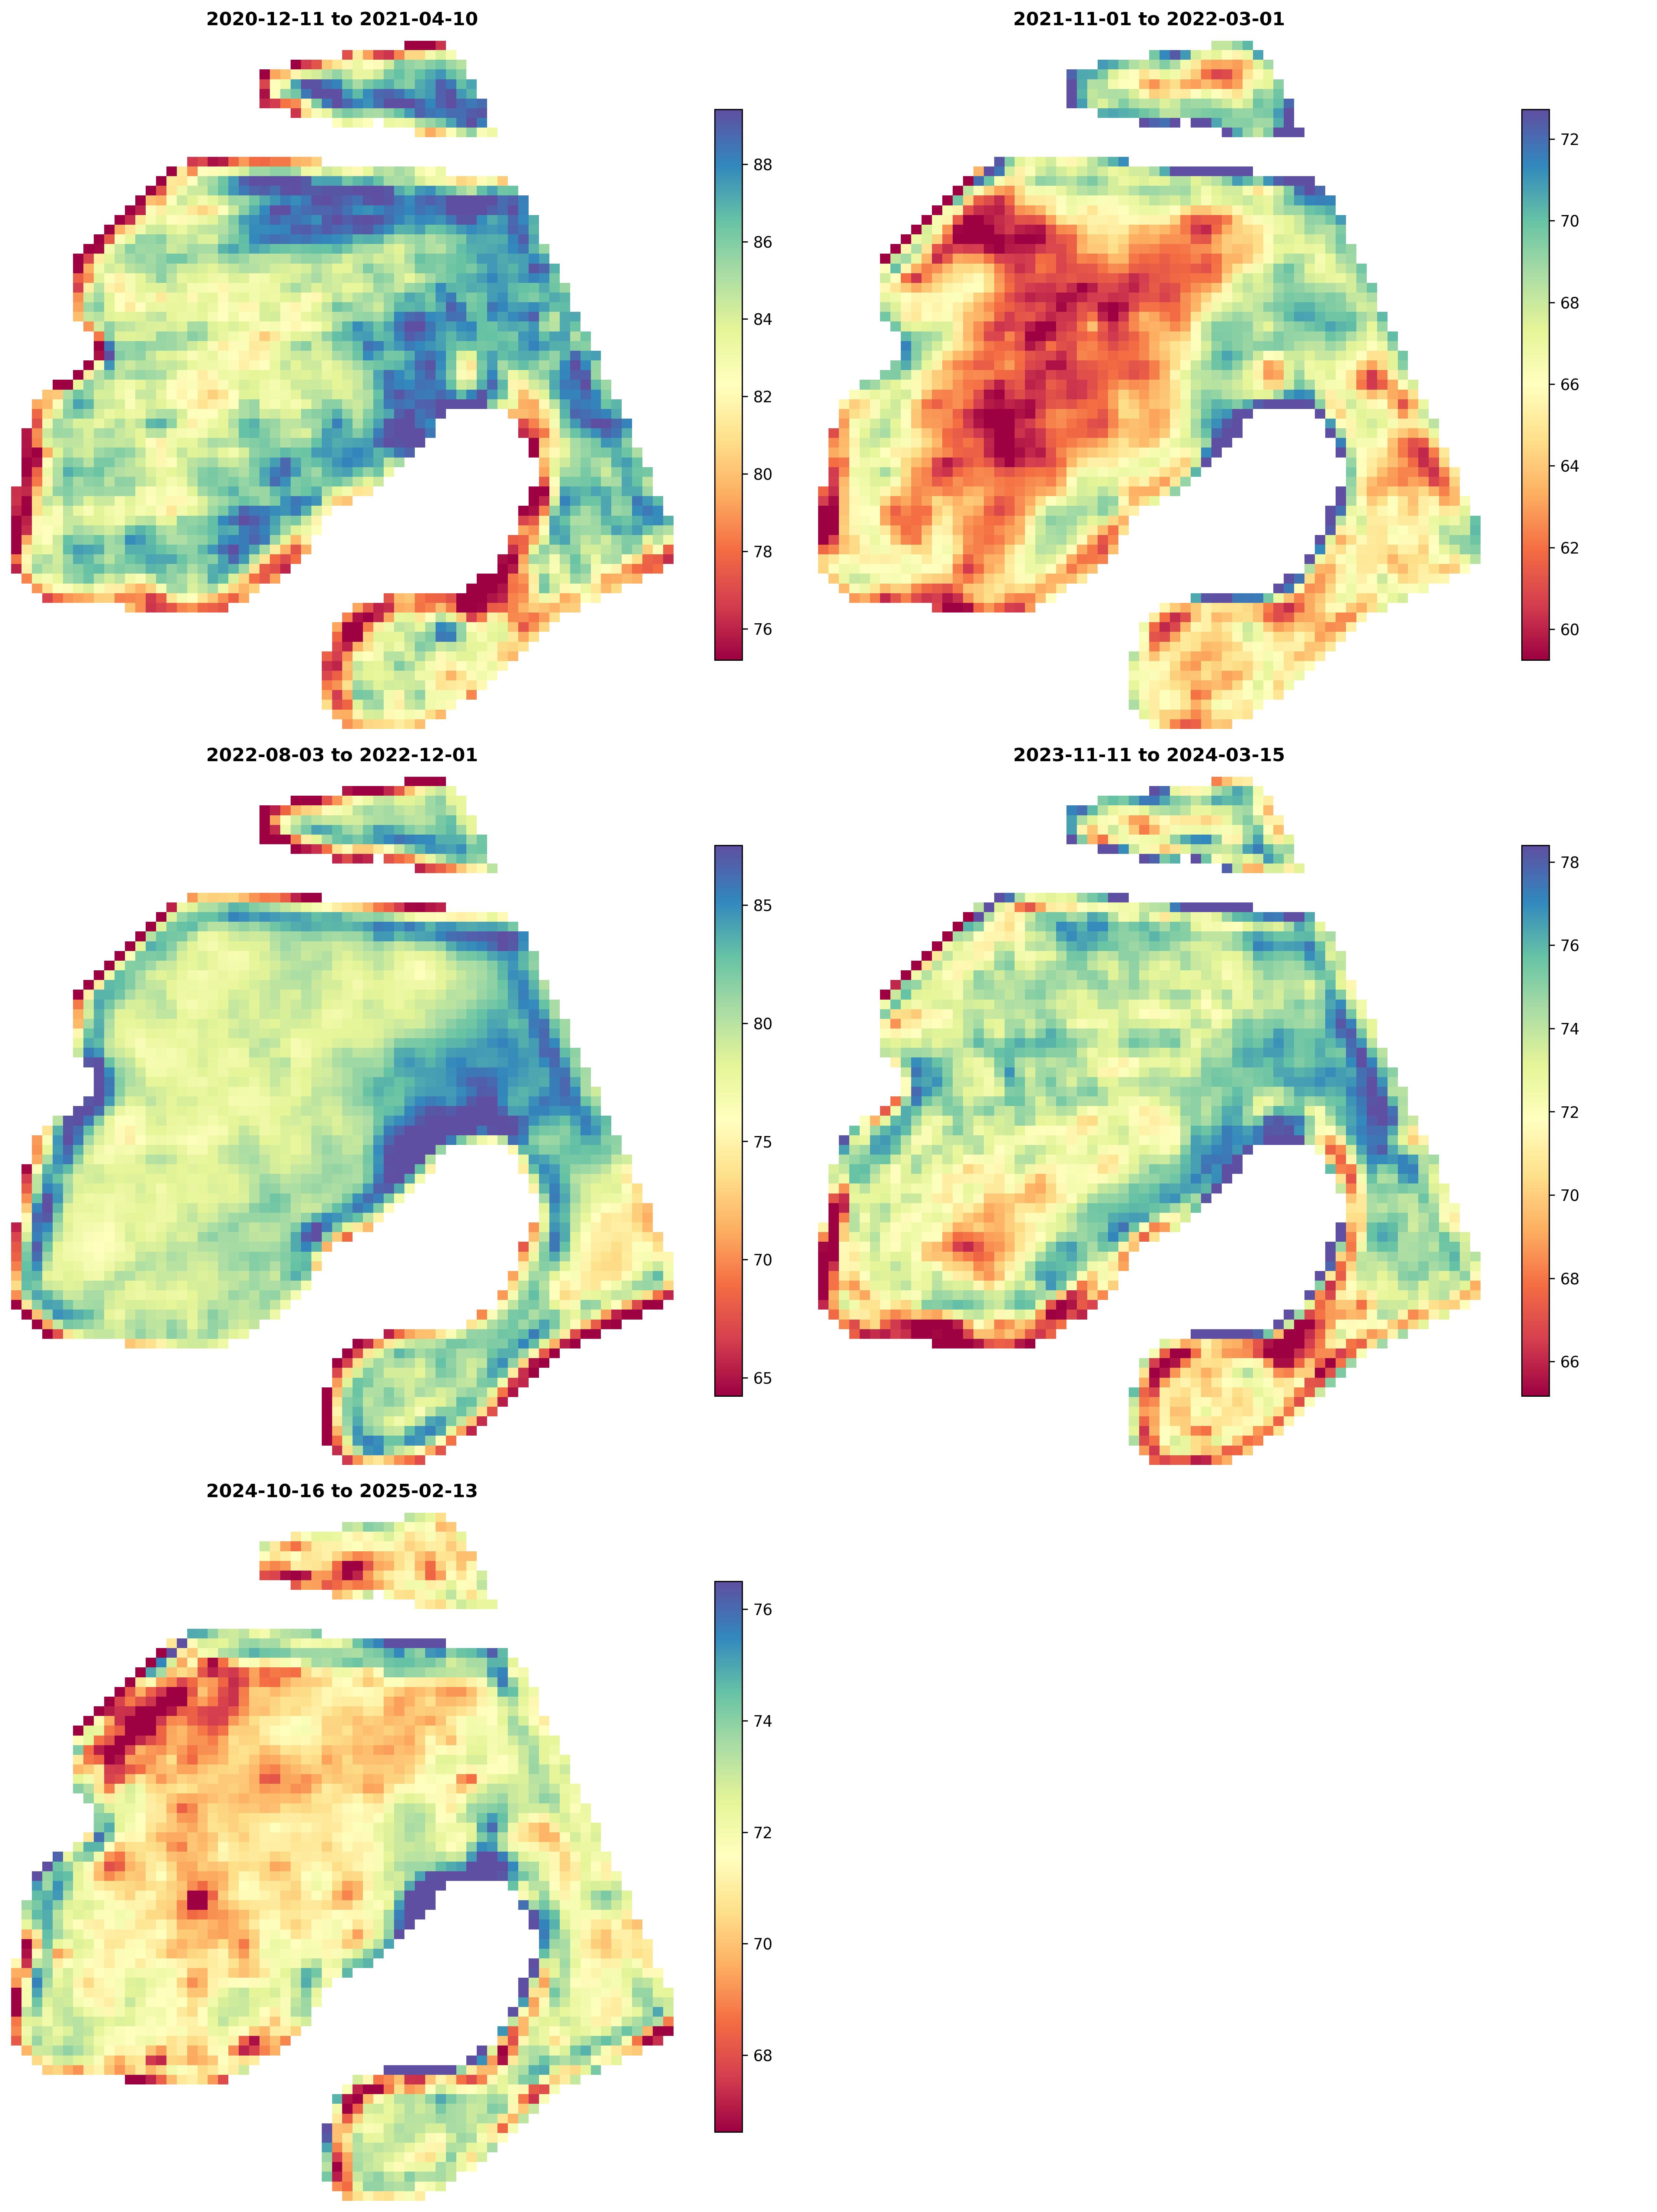
Productivity zones: Map containing Productivity zones 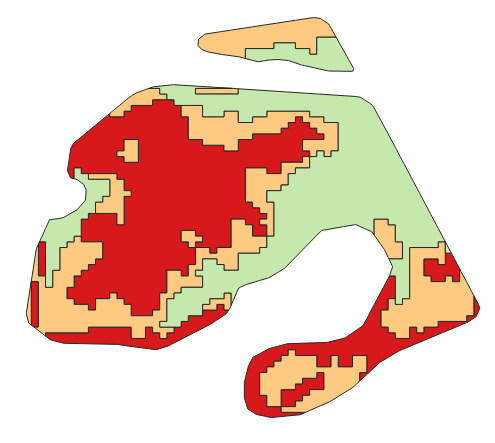
How to Use
Satellite subscription
The desired field has to be registered in Cropwise under an organization subscribed to a valid license to use Cropwise Satellite Image Service.
Area of validity
- The algorithm is capable of producing productivity zones maps for extensive annual field crops (corn, wheat, soybeans, etc.).
- The model algorithm and parameters are not country dependent.
Model limitations
- Extremely cloudy areas may lack sufficient images, which may decrease the quality of the final result.
- The model use Sentinel 2 images with 10x10 m pixels. Hence it is not recommended to use the model for fields below 1 ha.
Default Configuration
By default, the output is a GeoJSON file that includes the shapes of each zone within the field, along with additional supporting information.
The model is mainly used to generate field maps divided into contrasting productivity zones. The 'group' column is ordered by productivity (1= lowest productivity zone). These maps then support precision agriculture by enabling in-field varying input management such as variable seed density or variable product and fertilizer rates.
By default, the model uses all available crop seasons specified in the parameters to perform zoning. Each crop season represents a single crop, not a calendar year, so fields with double cropping will show two seasons for the same year. In the default case the model also automatically recommends the number of zones to use, automatically set between two and seven.
If any season is split between multiple crops, the algorithm automatically excludes those seasons from the analysis. The ignored seasons are listed in the ignored_seasons attribute of the output GeoJSON. This prevents skewed results in the final productivity zoning. If all identified seasons for a field are split between different crops, there will not be enough data to run the model, and an error message will be returned.
There is also a supporting attribute productivity_adjustment_factor which indicates the percentage difference in productivity of each zone relative to the mean yield expectation for the field.
Advanced and Custom Configuration
Number of Zones
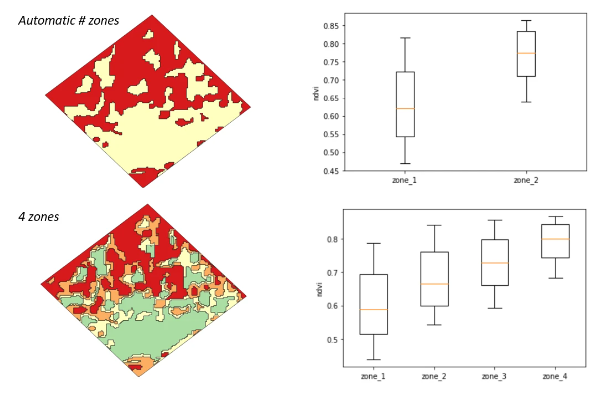
By default, the model automatically selects the best number of zones based on the field productivity and history of images. However, if the proposed number is not desired, users can manually specify the number of zones using the n_zones parameter. The n_zones parameter accepts values between 2 and 10; it is important to note that any value of 1 or below will trigger automatic zone selection. In the example below, two zones were selected instead of the three recommended by the model.
 Edited response after discarding three seasons and selecting two zones
Minimal Polygons Size
In certain scenarios, it may be necessary to remove small polygons from the final map. This can be achieved by specifying a minimum area threshold (in m²) using the min_area_size parameter. Polygons smaller than the selected threshold will be merged with the surrounding zone.
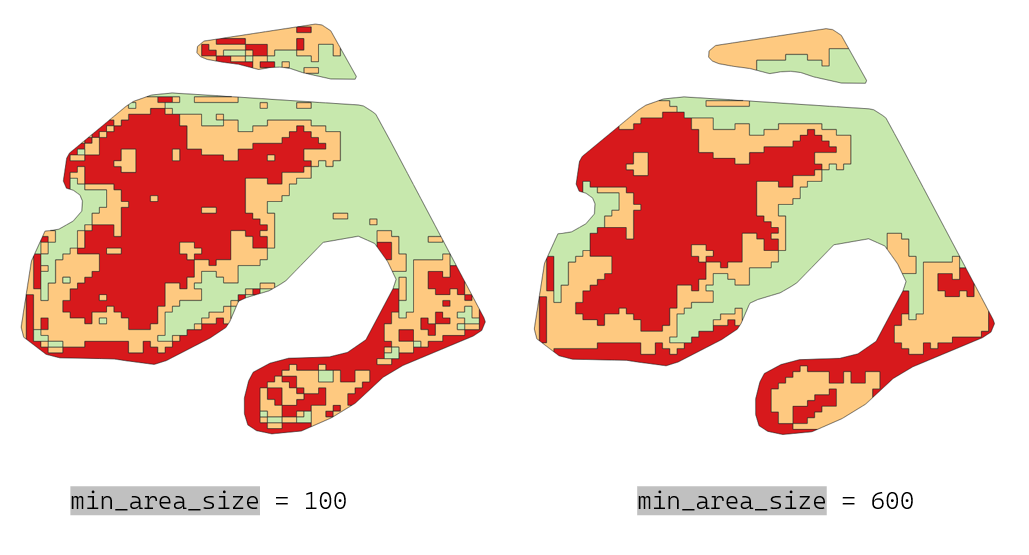 Example of two different settings for min_area_size parameter.
Custom Crop Season Selection
One advantage of having a two-step approach where the user first get the list of image metadata and seasons through the interval_suggestion endpoint is the flexibility it gives. Users can exclude specific crop seasons from analysis by modifying the interval_suggestion output before it is sent to the productivity_zones endpoint. This is achieved by directly editing the JSON response from the interval_suggestion endpoint.
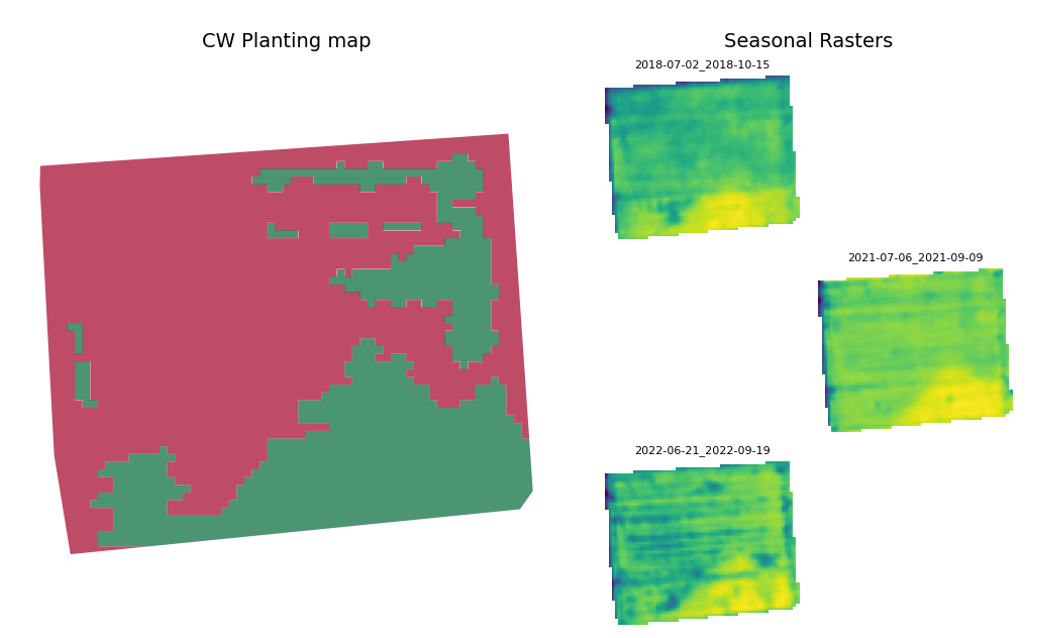
Additionally, users can visualize individual season rasters. These are visual representations of productivity for a single season. The seasonal_raster endpoint generates an image that represents the productivity for each season, assisting users in their season selection. In the below example, three seasons were removed from the automatic selection, done in interval_suggestion, which in turn changed the final map produced.
 Automatic response without editing seasons
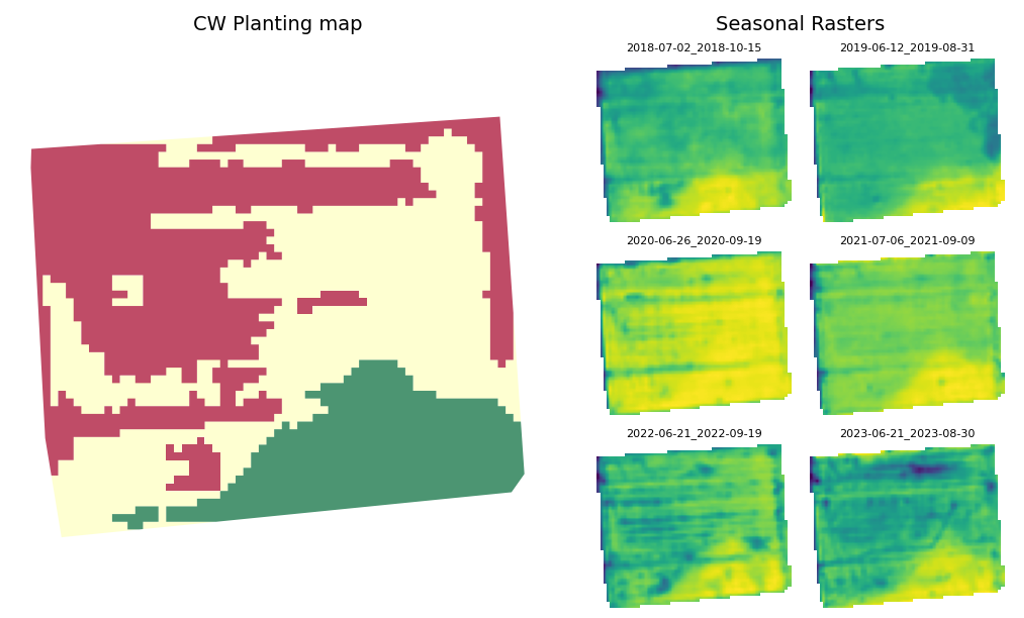
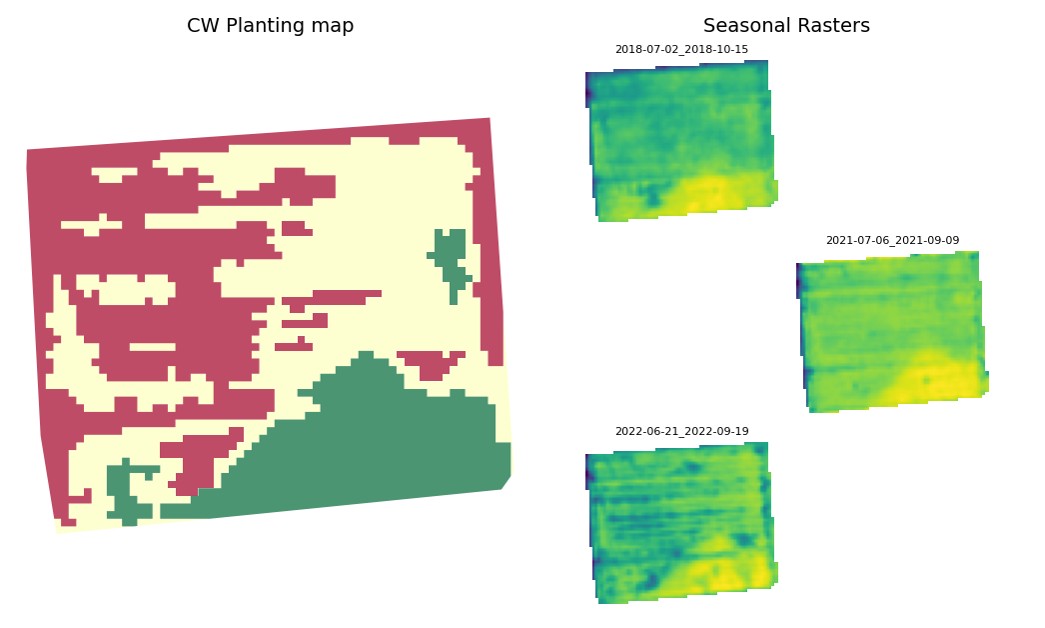 Edited response after discarding three seasons
How to interpret insights
Productivity Zones maps are provided as GeoJSON files. Each file contains the shapes (polygons) that define the each zone within a field, along with supporting information. There are additional information specific to each zone and information pertaining to the entire productivity map result.
Zone-Specific Additional Information:
- NDVI percentiles
- Productivity adjustment factor
Whole Productivity Map Additional Information:
- Ignored seasons
- NDVI Variability
NDVI Percentiles
For each zone, the model provides percentile values (p10, p25, p50, p75, and p90) calculated from the peak of each growing season. These percentiles enable users to construct boxplots that visually display the distribution of NDVI values at the seasonal peak for each zone.
Productivity Adjustment Factor
productivity_adjustment_factor provides a positive or negative value to be used in assigning a relative performance of each zone in relation to the entire field. For example, if a zone has a productivity_adjustment_factor of -0.06 it implies that historically it has presented a 6% less productivity than the field mean, whereas if it is 0.10 it implies that it has presented a 10% higher productivity compared to the field mean.
Ignored Seasons
In some seasons, fields may be divided between multiple crops or only partially planted. To ensure optimal performance of the productivity zones algorithm, these split seasons must be excluded.
If a season within the provided interval_suggestion is identified as split, it will be discarded and omitted from the productivity zones analysis. The final output will include an attribute named ignored_seasons, which lists the excluded seasons and the reasons for their exclusion.
Example:
{
    "productivity_zones": {
        "features": [
            "(...)"
        ],
        "type": "FeatureCollection",
        "ignored_seasons": [
            {
                "start_date": "2018-12-08",
                "end_date": "2019-04-07",
                "peak_date": "2019-02-06",
                "reason": "split"
            }
        ]
    }
}
NDVI Variability
Beyond individual zone data, the model also provides three field-level values that describe the overall NDVI variability across multiple seasons:
Variability:
- This metric quantifies how much vegetation growth varies across the field over multiple crop seasons.
- It answers the question 'Considering multiple crop seasons: How variable is the vegetation in the field?'.
- Low values indicate homogeneous vegetation growth in the field, whereas high values indicate contrast in growth among different areas.
Consistency:
- This assesses whether the spatial patterns of crop growth remain stable over multiple seasons.
- Answers the question 'Is the crop spatial heterogeneity consistent over multiple seasons or not?'
- Low values indicate an erratic spatial structure, whereas high values indicate consistent spatial structure across seasons.
VxC:
- Weighted average between VI and CI = (VI * 0.67) + (CI * 0.33).
- This is a weighted average of the Variability and Consistency metrics. It provides an overall assessment of both the extent of vegetation variation and the consistency of its spatial structure within the field.
- This value gives an overall assessment of how variable and how consistent the spatial structure of vegetation is in a field.
Use-case Example:
The productivity zones model aims to group areas in the field that present similar productivity and separate those that present a contrasting one. That productivity is characterized by seasonal aggregation of NDVI. The example below shows a sunflower field in Hungary, with the yield map (top left), the zones from this model (top right), a boxplot of yield by zones (bottom left), and the correlation between yield and the seasonal aggregation of NDVI for the season of the yield map (bottom right). This example shows the capacity of seasonal aggregation of NDVI to capture yield variability (R2: 0.7), which when combined across multiple seasons generates a zones map that reflects the yield variability in the field.
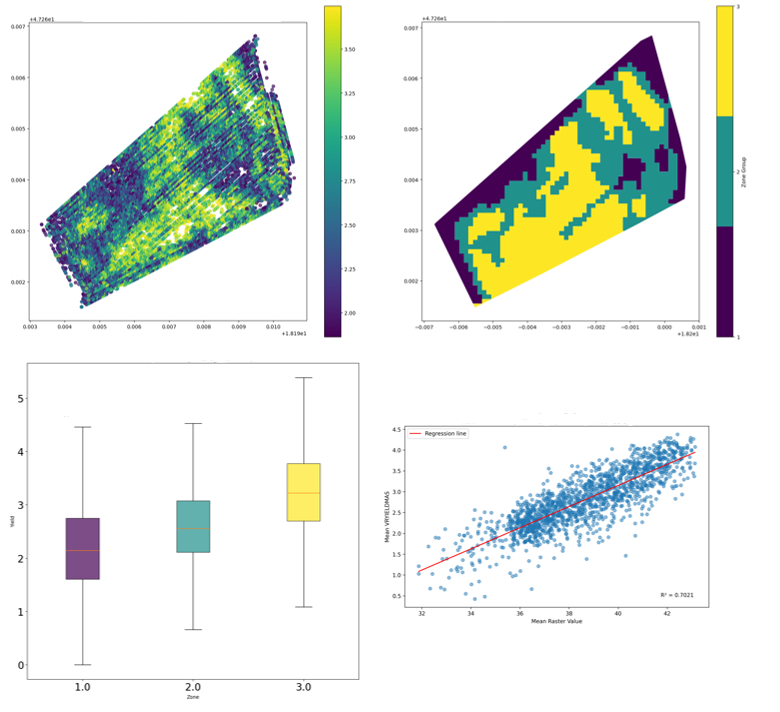 Sunflower field in Hungary: yield map (top left), productivity zones (top right), yield boxplot by zones (bottom left), correlation between yield and the seasonal aggregation of NDVI for the season of the yield map (bottom right)
System information
Processing times are directly correlated with field size due to the computational requirements of analyzing historical satellite imagery datasets. Response times may be extended for larger fields or during periods of high system utilization.
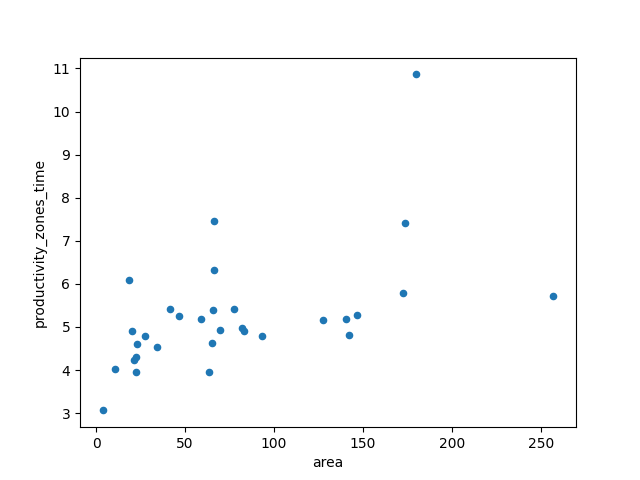 Productivity zones response time (s) against field area (ha)
Last edit: 10/10/2025 [JLP]